« July 2007 | Main | September 2007 »

August 2007 Archives

August 18, 2007

XBox DVD Remote Control Codes

Here are the address and command codes for each of the XBox DVD Remote's 27 buttons.

Button Address (hex) Command (hex)
menu 5 08
play 5 15
pause 5 19
title 5 1A
forward 5 1C
reverse 5 1D
stop 5 1F
skip+ 5 20
skip- 5 22
back 5 27
display 5 2A
0 5 30
1 5 31
2 5 32
3 5 33
4 5 34
5 5 35
6 5 36
7 5 37
8 5 38
9 5 39
info 5 3C
left_arrow 5 56
right_arrow 5 57
down_arrow 5 58
up_arrow 5 59
select 5 F4

PS: 20070901: I happened upon a list of the Xbox remote codes, here. LIRC looks like a cool project.

August 20, 2007

Gathering the XBox DVD Remote Codes: Method

Last time I presented a table of address and command codes, one for each of the XBox DVD Remote's 27 buttons. How did I come up with the table?

First, a recap: back in X. Start Making Sense, I displayed disappointment at Signaltap's partial scriptability, and resigned myself to manually processing the data, in heavy interaction with Signaltap's GUI and Excel. This solution, though workable, didn't sit well with me, and fortunately I found a better method.

The Virtual JTAG Interface To The Rescue!

The sld_virtual_jtag megafunction, aka the Virtual JTAG interface (VJI), provides access to the same on-chip hardware resources that signaltap makes use of, but in a far more user-configurable form. Here's what the Mighty Altera Corporation says:

The megafunction can be used to diagnose, sample, and update the values of internal parts of your logic. With this megafunction, you can easily sample and update the values of the internal counters and state machines in your hardware device.

You can build your own custom software debugging IP using the Tcl commands listed above to debug your hardware. This IP communicates with the instances of the sld_virtual_jtag megafunction inside your design.

I used the VJI, suitably wrapped in glue logic, to gather data under control of a tcl script. I'll give a brief textual description of the method I used; check out the attached design files for more details.

Remember that my goal is to measure the durations of the mark and space values emitted by the remote control. The measurement circuit consists of these functional blocks:

  • An edge detector, which provides a 1-cycle pulse on each rising or falling edge of the incoming IR signal
  • A 20-bit counter, which increments on each clock pulse, and synchronously resets to 0 on each IR edge
  • A 20-bit FIFO, which is written with the counter value on each IR edge

Those simple circuit elements, running at 50MHz, write the sequence of IR duration values into the FIFO. The read side of the FIFO is controlled by the VJI, which exposes two values to the outside world:

  • rdempty: is the FIFO empty?
  • readdata: data from the FIFO

A tcl script (pseudo code, here - the actual script is get_data.tcl) running on the host gathers the FIFO data:

while (FIFO nonempty)
  read FIFO
  print FIFO readdata
end while

The script process_data.bat transforms data from all raw data files into a single summary file and one processed data file per raw data file. So, that's the basic operation of the data-acquisition logic. Next time I'll do some analysis on the gathered data.

Postscript: The testbench for this data acquisition fiesta is "tb_6"; here are the files. This testbench could actually be useful to anyone trying to analyze a serial protocol, so it's worthwhile to give a bit of an overview. The zip file contains these files:

  • go.sh: Build bash script. Creates the quartus project, compiles the design and configures the FPGA.
  • pgm.sh, make_tb.tcl, compile_tb.tcl: Lower-level build tcl scripts.
  • top.v: Design top-level. Synchronizes the incoming IR signal to the system clock, instantiates module "sys".
  • sys.v: The real guts of the design. Implements the edge detector, the counter and the FIFO. Instantiates the virtual jtag wrapper module (vj_rw). Drives the test bench code ("06.") onto the seven-segment display.
  • fifo.v: A dual-clock FIFO, delivered by the FIFO megawizard.
  • vj_rw.v: Assorted logic to provide a clean interface to the virtual-jtag-interface, from the outside world. Instantiates the virtual-jtag-interface itself (vj).
  • vj.v: The actual virtual-jtag-interface, as delivered by the virtual jtag interface megawizard.
  • get_data.tcl: The data acquisition script, as described above. Reads the FIFO, writes the values to the console, slightly formatted (newlines are inserted for "long" durations, which are supposed to be IR transmission boundaries
  • process_data.bat: A perl script which transforms the raw data (as delivered by get_data.tcl) into "cooked" data files, a summary file of IR codes, and an html table for pasting here. This file is very XBox-remote-specific.

August 26, 2007

WWASD?

I've got the data from hundreds of remote-control transmissions in a handy file format. What would a statistician do? Analyze it, of course!

Remember that the XBox remote transmits in the RCA protocol; that protocol allows for 5 different sorts of pulses:

  • mark_4ms: nominal 4 ms "mark" (active IR transmission)
  • space_4ms: nominal 4ms "space" (no IR transmission)
  • mark_500us: nominal 500μs mark
  • space_1ms: nominal 1ms space (logic 0)
  • space_2ms: nominal 2ms space (logic 1)

The real world is usually a bit messy - in this particular case, the data I measured coming out of the IR receiver module diverges from those nice values. So, by trial and error, I determined an upper and lower bound for each pulse type. I bin the data into the 5 types according to these thresholds (a value falls in a bin if it is in the range (min-bin-value, max-bin-value), where the parens represent noninclusive boundaries):

bin min-bin-value max-bin-value
mark_4ms 4.01 4.07
space_4ms 3.9 4.0
mark_500us 0.5 0.56
space_1ms 0.9 1.0
space_2ms 1.94 2.0

Notice that the "mark" bins have larger than nominal values, while the "space" bins have smaller than nominal values. (By the way, by design, every duration value I collected falls into one of the 5 bins.)

Here are some statistics on the collected data, grouped by bin:

bin average value min value max value deviation from nominal (%) number of samples
mark_4ms 4.046216011 4.02744 4.06724 +1.155% 1514
space_4ms 3.979702576 3.96054 3.99844 -0.507% 1514
mark_500us 0.539785722 0.51732 0.55442 +7.957% 37850
space_1ms 0.95811015 0.94466 0.98132 -4.189% 18168
space_2ms 1.965947435 1.94998 1.98714 -1.703% 18168

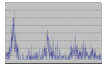
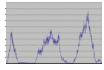
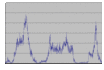
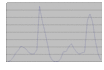
Average, min and max are useful, and reveal basic facts, but also hide other things. For a full picture, there's nothing like... a picture. I discovered something interesting when I plotted each bin's data as a histogram. Click on a chart thumbnail to see the full-size version:

IR Receiver Output

Bin Histogram
mark_4ms
space_4ms
mark_500us
space_1ms
space_2ms

Isn't that peculiar? The data for each bin is clustered into groups rather than being a nice normal distribution.

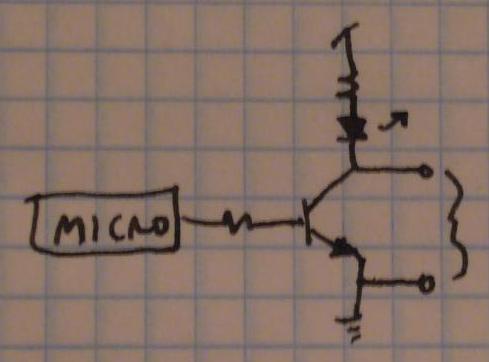
Well. The measurement is made on the output of the IR receiver; could that receiver be distorting my nice clean data? Moving upstream a bit, I took apart the Xbox remote control, and found a very simple circuit driving the IR LED. (The box labled "micro" is an integrated circuit whose markings were pretty much indecipherable - presumably some simple microcontroller.)

measurement3.jpg

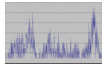
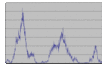
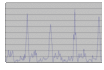
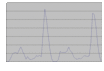
I've taken a new set of measurements between the cathode of the IR LED and ground.

Internal-toXBox-Remote, IR cathode-to-ground

Bin Histogram
mark_4ms
space_4ms
mark_500us
space_1ms
space_2ms

These histograms show that the XBox remote itself is emitting pulse durations which tend to cluster into sub-bins separated by about 20μs. The histograms have higher peaks than those measured at the IR output - perhaps the IR receiver circuit has a "smearing" effect (I can imagine that the automatic gain-control part of the receiver would have this effect).

Move forward!

This measurement and analysis is fun laboratory work, but I'm anxious to get started on some firmware. Were I to continue in this vein, I'd work on some of these tasks:

  • Investigate the effect of transmitter-to-receiver distance on pulse durations
  • Get at least one more Xbox remote, and compare pulse duration statistics
  • Try to find a datasheet for the alleged microcontroller in the Xbox remote
  • Probe more pins on the alleged microcontroller - try to correlate pulse duration with power supply, incoming clock frequency, ...

But instead, now it's time to get back to my long-neglected f2013. As a preliminary step, I plan to learn about the f2013's clock source options think about the problem of debugging visibility in embedded systems.

Oh, right. Here are the up-to-date tb_6 (IR receiver measurement) and tb_7 (IR LED cathode measurement) files.

About August 2007

This page contains all entries posted to Aaron's Sandbox in August 2007. They are listed from oldest to newest.

July 2007 is the previous archive.

September 2007 is the next archive.

Many more can be found on the main index page or by looking through the archives.

Powered by
Movable Type 3.31