Here's what the Mighty Altera Corporation has to say about signaltap:
The SignalTap® II logic analyzer is a second-generation system-level debugging tool that captures and displays real-time signal behavior in a system-on-a-programmable-chip (SOPC), giving you the ability to observe interactions between hardware and software in system designs.
Right right right. For my purpose, signaltap is just an on-FPGA digital sampling scope, whose UI happens to live in Quartus. I'll use it to study the data stream from the Xbox remote control.
So, how do I use this thing? Three steps:
- Define the probe
- Connect the probe to my signals
- Capture and view trace data
1. Define the probe:
Quartus provides a GUI for step-by-step definition of signaltap probe parameters, in the menu:
Tools/Megawizard Plugin Manager/JTAG-accessible Extensions/
  SignalTapII Logic Analyzer
Here are the parameters and my choices:
- Language (AHDL, VHDL, Verilog) - I like Verilog, myself
- output file name - I choose "st.v"
- sample depth - maxes out at 128K; I'll use 32K for now.
- data input port width - I just need one data signal, for the ir signal.
- trigger input port width, trigger levels - I just need one of these.
- type of each trigger - there's an "advanced" trigger type, but "basic" will work fine for this application.
- a selection of optional output files - I'll ask for "st_inst.v", which demonstrates how to make an HDL instance of a probe. Quartus is dumb, so it offers me a choice of VHDL and AHDL output files as well. It really is trying to be helpful, I promise. Just smile and nod.
At the end of the process, Quartus delivers the files "st.v" and "st_inst.v". The file "st.v" defines the module "st", and it's full of arcane stuff I don't (and am not meant to) understand. That's fine - all I need to do is make an instance of this module and connect to it.
2. Connect the probe to my signals:
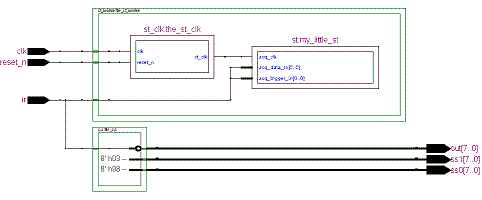
Well, I've changed my testbench design a bit, for testbench 04. I've moved my actual system logic into a module, "sys", and there's a new module, "st_module", for everything related to signaltap. Here's the system top-level, as a block diagram (click for a full-size, more-legible view):
There's not much to say about module "sys"; it just drives the green LEDs from the IR signal, and puts the testbench ID on the seven-segment display, just like testbench 03 did. But what's going on in module "st_module"? There are two sorts of things:
- Some ancillary logic for signaltap. Module "st_clk" creates a low-frequency (390625 Hz) square wave by dividing down the 50 MHz input clock. See "st_clk.v" for the nitty gritty.
-
An instance of my signaltap probe, "st". The probe has three ports:
- .acq_clk (st_clk): this is the signaltap sampling clock.
- .acq_data_in (data_in): this is the data signal to sample (driven from the IR receiver's output).
- .acq_trigger_in (data_in): oddly, I'm wiring the IR data signal into another port, the trigger input. This will make sense when I describe data acquisition, below.
3. Capture and view trace data:
First, I compile the design and download the sof (using the script "go.sh"). Then, there's just one more thing to do: Quartus' signaltap application requires a file of type "stp". This file stores the trigger configuration, signal aliases and other stuff which doesn't belong in the signaltap probe instance. (Changing the stp file generally won't require a recompile.) In other signaltap flows, creating the stp file is a tortuous and labor-intensive process involving the dreaded Node Finder. With this HDL-centric flow, I create my stp file with a click of the mouse, using menu item:
File/Create|Update/Create SignalTapII File from Instance(s)
I specified file name st.stp (lacking any more creative ideas), and opened it with:
File/Open/st.stp
Then the signaltap GUI connects to the hardware and it's time to configure my trigger, then acquire some data.
The signaltap GUI consists of multiple windows, with many selections disabled (most parameters are only alterable via the Signaltap Megawizard). Somewhere in there, though, there's a window for defining basic trigger levels, like this:
I Right-click on the trigger level for acq_trigger_in[0] and select "Falling Edge":
Now the probe is configured to start capturing data on a falling edge of the IR input signal.
Next, I start pushing the DISPLAY button on the Xbox remote control, to create an interesting data stream, and click the "Run Analysis" button:
After a few seconds, I get: trace data!
It's in an inconvenient graphical form, but data is data. Fortunately, Quartus lets me export the data to various text formats. That'll come later.
Now that I'm looking at and thinking about my data, I can already see that something funny is going on. Even if I don't push any buttons on the Xbox remote control, the signaltap probe is triggering, and I get data like this:
I can also see this on the green LEDs: just sitting on the table, even if I cover the IR receiver, the LEDs are flickering away randomly, pretty much continually. After I push a button on the remote, though, there's up to a second of no flickering - then the flicker is back. Perhaps an AGC artifact?
A dim half-understood fact about high-gain amplifiers and oscillation is surfacing in my memory. I'll think about this problem next - if possible, I want to eliminate this noise from my data stream.
